The Go Blog
Goroutine Leak Profiles
Go’s concurrency features are powerful and easy to use, but that same ease can sometimes lead even seasoned developers to make mistakes. Fortunately, the Go ecosystem comes equipped with useful tools for debugging, e.g., the race detector, but even existing tools may miss some concurrency bugs, such as the topic of this article, the goroutine leak.
Goroutines synchronize or exchange information via shared concurrency primitives, e.g., channels, locks, and wait groups. While communicating, goroutines often block on these primitives, as in, wait until some condition is met; ubiquitous examples include waiting to acquire a held mutex, or receive a message over a channel. Goroutines can also block on operating system operations, like reading from a network socket or a file.
We may consider a goroutine leaked if it is blocked,
but the conditions needed to unblock it can never be met.
Over time, an accumulation of leaked goroutines degrades
performance through excessive memory usage (by the leaked
goroutines themselves or the memory they reference), as well as
CPU usage from the garbage collector, especially
if GOMEMLIMIT is in use.
Goroutine leaks can be notoriously difficult to detect.
In unit testing, the most significant breakthroughs include
the open-source library goleak,
which can instrument individual tests to signal any
un-terminated goroutines after the test wraps up as suspicious.
Similarly, Go 1.25 introduced the synctest package to
the standard library; it can significantly improve
the quality of unit tests in concurrent code by giving
Go developers more control over the ordering of concurrent events
in order to reliably test hard-to-reproduce scenarios.
Unfortunately, neither approach can check for goroutine leaks in production systems, especially at larger scales, which may behave in ways unaccounted for by tests. Goroutine profiles are a rudimentary way to check for operations that block too many goroutines, or analyze growth trends. However, goroutine profiles cannot distinguish between goroutines which are leaked, and those which are temporarily blocked in high numbers by design, e.g., as caused by increased traffic in a microservice. Likewise, leaks which are low in number may slip by undetected for many years.
Go 1.27 introduces the goroutine leak profiler,
a flexible and lightweight mechanism for finding
goroutine leaks in running Go programs, including production systems.
Unlike previous approaches, which require human analysis,
this mechanism is precise and generates little-to-no false positives.
The trade-off is that it is limited to a subset of goroutine leaks:
goroutines permanently blocked on channels or primitives
in the sync package.
Luckily for us, this already covers a very large subset of goroutine leaks,
as we’ll see in our examples.
In the following sections, we showcase how to use the feature, followed by some additional examples of detectable leaks, and a description of the underlying implementation and trade-offs.
Example: concurrent workers
Consider a function that processes work items concurrently:
type result struct {
    res workResult
    err error
}

func processWorkItems(ws []workItem) ([]workResult, error) {
    // Process work items in parallel, aggregating results in ch.
    ch := make(chan result)
    for _, w := range ws {
        go func() {
            res, err := processWorkItem(w)
            ch <- result{res, err}
        }()
    }

    // Collect the results from ch, or return an error if one is found.
    var results []workResult
    for range len(ws) {
        r := <-ch
        if r.err != nil {
            // This early return may cause goroutine leaks.
            return nil, r.err
        }
        results = append(results, r.res)
    }
    return results, nil
}
Because ch is an unbuffered channel, each worker goroutine blocks when sending
its result until the main goroutine receives from the channel.
If processWorkItems returns early due to an error, the receiving loop terminates,
and all remaining sender goroutines block forever.
This example is emblematic of a common mistake discovered in real Go programs, including Uber production services. Let’s see how we can find these leaks by using the new goroutine leak profiler.
Debugging with the goroutine leak profiler
The profile is available through the
runtime/pprof package, as the
goroutineleak profile type, or by installing the profile handlers defined
by the net/http/pprof package.
If you already have net/http/pprof set up in your service,
then you don’t need to do anything else! The profile will be
automatically made available for collection at the /debug/pprof/goroutineleak
endpoint on whatever host and port the handlers are installed.
Let’s put our concurrency bug in context and set up the net/http/pprof package.
This way, you can try it yourself!
package main

import (
    "errors"
    "log"
    "net/http"
    _ "net/http/pprof"
    "time"
)

type workItem int
type workResult int

func processWorkItem(w workItem) (workResult, error) {
    time.Sleep(10 * time.Millisecond)
    if w == 5 {
        return 0, errors.New("simulated error")
    }
    return workResult(w * 2), nil
}

type result struct {
    res workResult
    err error
}

func processWorkItems(ws []workItem) ([]workResult, error) {
    ch := make(chan result)
    for _, w := range ws {
        go func() {
            res, err := processWorkItem(w)
            ch <- result{res, err}
        }()
    }

    var results []workResult
    for range len(ws) {
        r := <-ch
        if r.err != nil {
            return nil, r.err
        }
        results = append(results, r.res)
    }
    return results, nil
}

func main() {
    // Start pprof server
    go func() {
        log.Println(http.ListenAndServe("localhost:6060", nil))
    }()

    // Repeatedly trigger the leak
    for {
        items := []workItem{1, 2, 3, 4, 5, 6, 7, 8, 9, 10}
        _, err := processWorkItems(items)
        if err != nil {
            log.Printf("Error processing items: %v", err)
        }

        time.Sleep(time.Second)
    }
}
Build the program above, then run it:
$ go build -o leaky
$ ./leaky
Collecting the profile
It won’t take long for the program to start accumulating leaks, which you can then view by using the web UI at http://localhost:6060/debug/pprof.
Alternatively, you can collect the goroutine
leak profile using curl, and then examine it with go tool pprof:
$ curl http://localhost:6060/debug/pprof/goroutineleak > leak.prof
$ go tool pprof leak.prof
Type: goroutineleak
Time: 2026-03-01 13:19:49 UTC
Entering interactive mode (type "help" for commands, "o" for options)
(pprof) list processWorkItems
Total: 116
ROUTINE ======================== main.processWorkItems.func1 in .../main.go
         0        116 (flat, cum)   100% of Total
         .          .     31:           go func() {
         .          .     32:                   res, err := processWorkItem(w)
         .        116     33:                   ch <- result{res, err}
         .          .     34:           }()
The profile reveals the goroutines leaked at
ch <- result{res, err} (line 33), pinpointing the culprit operation.
Notably, the longer the program is running, the larger the number of leaked
goroutines.
Addressing the leak
This leak can be simply fixed by giving ch a buffer:
ch := make(chan result, len(ws))
This allows all the work item goroutines to send a message without blocking
in the event of a premature return of processWorkItems.
We list more real-world examples in this section.
Implementation
This section is for those interested how leak detection works under the hood of the goroutine leak profiler. For details strictly pertaining to performance overhead and limitations, skip ahead to this section.
Core concept
Let’s start with an initial observation: if a goroutine is blocked over some concurrency primitive that no other goroutine has access to (in this case, via a reference in memory), then it is obviously leaked. This is already a strong lead, we can generalize it further into a definition for when a goroutine is not leaked, a property we term as liveness. We formally define liveness, an inductive property as follows:
A goroutine is live if:
- it is not blocked by a concurrency primitive, or
- at least one concurrency primitive that blocks it is referenced by another live goroutine.
In the trivial case, goroutines which are not blocked are obviously not leaked. In the inductive case, the underlying assumption is that any goroutine which is not leaked may eventually use concurrency primitives it references to unblock any other goroutines blocked by those primitives.
To find all live goroutines, we start from the obviously live unblocked goroutines and trace any references they hold, i.e., through their local variables, to find the concurrency primitives they have access to. We then incrementally include any goroutines blocked over those primitives as live, and repeat the process until no additional live goroutines are discovered.
Fortunately for us, the Go runtime already computes memory reachability through the garbage collector (GC), so the next step is to adapt the GC to suit our purposes. You can quickly compare the two GCs with the following diagrams:
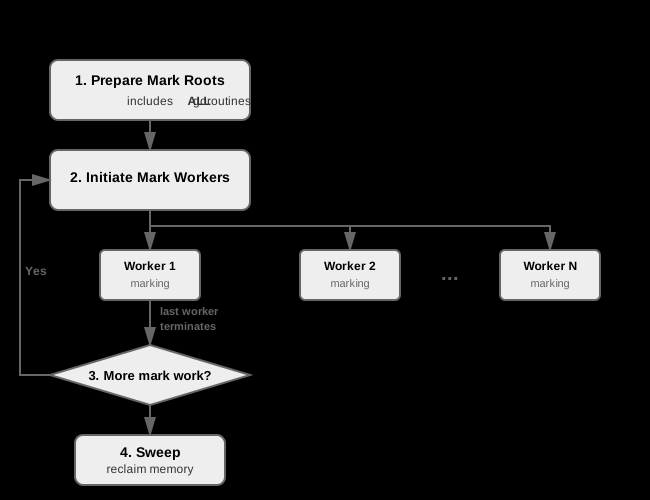
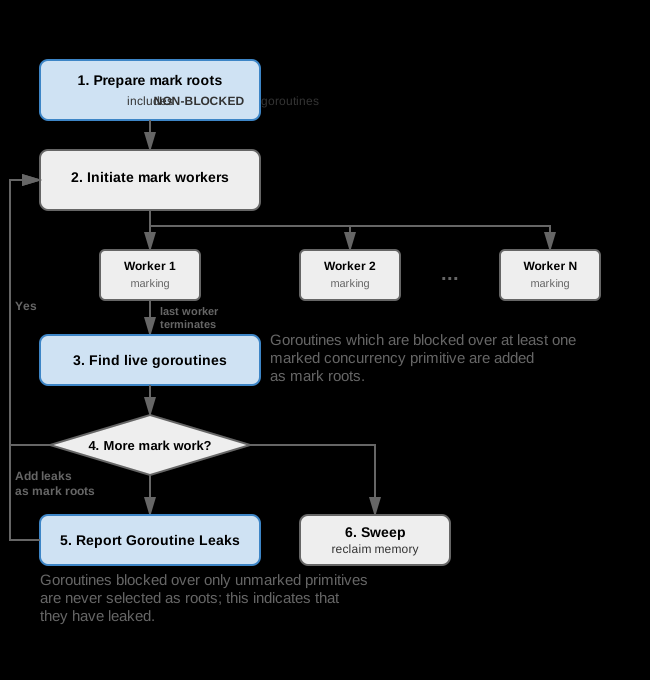
A complete overhaul of the GC is not necessary. The Go runtime uses a concurrent tri-color mark-and-sweep garbage collector, (now with the Green Tea variant!), so its MO already neatly aligns with our goals. Only a few key changes are needed:
- In the initial phases, the regular GC marks all goroutines (and global variables) as reachable, such that they would never be considered garbage, i.e., they are mark roots. We change it to instead only include unblocked goroutines, since these are guaranteed to be live.
- This is followed by the marking phase, where the GC traces objects referenced (transitively) by the mark roots, and marks them as usable memory. Even though we do not modify this phase directly, the changes in step 1. implicitly ensure that the GC only marks memory referenced by live goroutines.
- The marking phase is finalized by inspecting all the blocked goroutines not included as mark roots in step 1. If a goroutine is blocked by at least one concurrency primitive that has been marked in step 2., it is added as a mark root, and the GC resumes the marking phase from step 2. This coincides with the inductive step in the definition of liveness.
- Once all live goroutines have been discovered, any goroutine which has not been added as a mark root has its status set to leaked.
- The marking phase then resumes one last time with all the leaked goroutines added as mark roots, allowing the GC to mark all the memory it would have marked during a regular run.
Once the GC cycle is complete, the goroutine leak profiler picks up like in a regular goroutine profile, and filters for strictly leaked goroutines.
Limitations
The examples above demonstrate the usefulness of goroutine leak profiles. Nevertheless, the garbage collector has some limitations that may lead it to miss leaks:
-
Memory overreach: if a concurrency primitive is consistently reachable through global variables or runnable goroutines, then goroutines blocking on it are never reported as leaked, even if that concurrency primitive is never used in the future.
This can be alleviated by better regimenting access to concurrency primitive references, and more clearly delineating their lifecycle.
-
Non-standard blocking: For the sake of correctness, goroutine leak detection is strictly limited to Go first-class concurrency primitives, which includes: channel send and receive operations (including over
nilchannels), blockingselectstatements, i.e., with nodefaultcase, up to, and includingselectstatements with no cases, and members of thesyncpackage, specificallyMutex,RWMutex,WaitGroupandCond.Goroutines blocked for any other reason, e.g., file and network IO, or direct system calls are never considered as leaked. This likewise applies for custom, user-defined concurrency, e.g., spin locks, unless they rely on the primitives outlined above for their underlying implementation.
-
Non-determinism: leaks can be detected only after they have occurred, but cannot be otherwise predicted, so reproducing and diagnosing leaks in flaky programs continues to be a challenge. For the best results, we encourage mixing approaches, by using goroutine leak profiles at various layers, up to, and including production, as well as comprehensive test suites instrumented with
goleakandsynctest.
Performance impact
Goroutine leak detection is carefully designed to minimize performance impact, but there are, nevertheless, some costs.
While memory overhead is negligible, only limited to small additions
required for bookkeeping, goroutine leak detection can be slower
than the regular GC.
This is best illustrated through a pathological case we
call the “daisy-chain”:
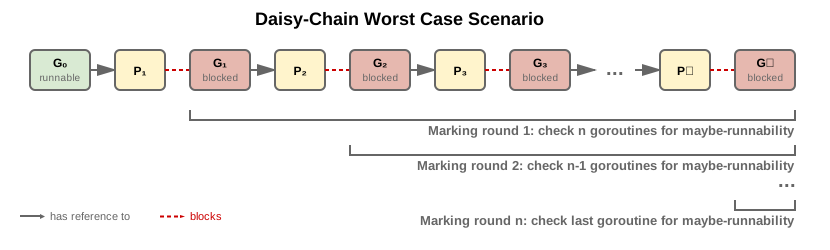 In this leak-free example, runnable goroutine G₀ has a
reference to primitive P₁ which blocks G₁, and so on.
In this leak-free example, runnable goroutine G₀ has a
reference to primitive P₁ which blocks G₁, and so on.
This implies that proving liveness for some Pᵢ₊₁, requires proving liveness for Pᵢ, which introduces two costs:
- The GC marking phase is effectively serialized relative to the order in which goroutines can be scanned, as all the memory reachable from some Pᵢ must be marked before Pᵢ₊₁ can be added as a root.
- The inspection currently checks all blocked goroutines at the end of each marking round, for a worst-case of O(n²) steps for one GC cycle, where n is the total number of goroutines.
While the second point can eventually be optimized for, the first point is an intrinsic limitation of leak detection that cannot be circumvented.
Regardless, we remind the reader that, unless configured otherwise via runtime flags, the GC still operates concurrently with user code. Furthermore, if a goroutine leak can be observed at some point in time, then it can also be observed at any future point during the same execution. Periodic profiling infrastructures can therefore tune profiling frequency, e.g., every 4 hours, to minimize overhead at virtually no cost in leak detection capabilities.
Acknowledgements
Goroutine leak detection is the result of a research collaboration between Aarhus University, Washington University in St. Louis, and Uber, as presented in “Dynamic Partial Deadlock Detection and Recovery via Garbage Collection” (Saioc et al., ASPLOS 2025).
The transition from academic prototype to actual Go feature was made possible with the guidance of Michael Knyszek and Michael Pratt on the Go team at Google, and PJ Malloy (@thepudds).
Additional examples
The following are coding patterns that lead to leaks, as observed in industrial-scale codebases and open source projects, in ascending order of complexity.
You can quickly test drive the goroutine leak detector on them in the Go playground, as well as experiment with your own leaks.
Example: Double send
Some of the simplest leaks occur when more messages
are sent over a channel than expected.
Below, a goroutine is expected to send one message to the main goroutine
over an unbuffered channel.
However, the return statement is missing after the send operation
in the error case.
For every error, the sender will, therefore, attempt to send two messages,
which causes a leak.
func DoubleSend() {
    ch := make(chan any)
    go func(err error) {
        if err != nil {
            // In case of an error, send nil.
            ch <- nil
            // Return statement is missing.
        }
        // Otherwise, continue with normal behaviour.
        // This send is still executed, which causes a leak in the error case.
        ch <- struct{}{}
    }(fmt.Errorf("error"))
    // Receive only one message.
    <-ch
}
While the profile does not explicitly highlight the missing return
as the cause, it at least directs you to the faulty function, by
highlighting the leaking send operation.
(pprof) list DoubleSend
Total: 1
ROUTINE ======================== main.DoubleSend.func1 in .../main.go
         0          1 (flat, cum)   100% of Total
         .          .    118:   go func(err error) {
         .          .    119:           if err != nil {
         .          .    121:                   ch <- nil
         .          .    123:           }
         .          1    126:           ch <- struct{}{}
         .          .    127:   }(fmt.Errorf("error"))
         .          .    129:   <-ch
This leak can be addressed simply by adding a return statement after the
send operation in the error case.
Example: Early return
The inverse situation is just as common, where the receiver omits communication on some control flow paths, in what is effectively a simplified version of the introductory example.
// Incoming error simulates an error produced internally.
func EarlyReturn(err error) {
    ch := make(chan any)

    // Create a worker goroutine.
    go func() {
        // Send something to the channel.
        // Leaks if the parent goroutine terminates early.
        ch <- struct{}{}
    }()

    if err != nil {
        // The parent goroutine quits too early in case of an error.
        // Sender leaks.
        return
    }

    // Receive is only executed if there is no error.
    <-ch
}
The goroutine leak is exposed by the profile:
ROUTINE ======================== main.EarlyReturn.func1 in .../main.go
         0          1 (flat, cum)   100% of Total
         .          .    140:   go func() {
         .          1    143:           ch <- struct{}{}
         .          .    144:   }()
         .          .    145:
         .          .    146:   if err != nil {
The leak can be addressed by giving ch a buffer of size 1.
Example: Timeout
A variation of the Early return pattern above involves contexts
and non-deterministic choice (select statements):
func Timeout(ctx context.Context) {
    // An unbuffered channel is used to coordinate
    // a worker and parent thread
    ch := make(chan any)

    // Create worker goroutine
    go func() {
        // Perform some work then signal to the parent thread.
        ch <- struct{}{}
    }()

    // Wait for message from worker or context
    // to be cancelled or timed out.
    select {
    case <-ch: // Receive message from worker
    case <-ctx.Done():
        // Sender leaks because there is no
        // future rendezvous over the channel.
    }
}
If the context is cancelled before the sender synchronizes with the parent, the sender will leak:
(pprof) list Timeout
Total: 10
ROUTINE ======================== main.Timeout.func1.1 in .../main.go
         0         10 (flat, cum)   100% of Total
         .          .    198:           go func() {
         .         10    201:                   ch <- struct{}{}
         .          .    202:           }()
As in the previous example, the fix is to give the channel buffer of size 1.
Example: Range over channel without closing
Iterating over channels by using range
allows you to repeatedly receive values from a channel in a loop.
Once the channel is closed and all values that have been enqueued
in the channel’s buffer have been received, the loop exits.
Importantly, if the channel is never closed, a range loop will block
the executing goroutine forever.
Omitting the close operation is a common mistake, as below:
// Incoming list of items and the number of workers.
func noCloseRange(list []any, workers int) {
    // Create a channel that distributes work items.
    ch := make(chan any)

    // Create the worker goroutines.
    for i := 0; i < workers; i++ {
        go func() {
            // Each worker pulls items from the channel
            // and then processes it.
            for item := range ch {
                // Process each item
                _ = item
            }
        }()
    }

    // Queue items to the workers by using the channel.
    for _, item := range list {
        // The parent leaks by sending an item if workers == 0
        // or if all the workers panic, but the panic is recovered.
        ch <- item
    }
    // Otherwise, the channel is never closed, so workers
    // leak once there are no more items left to process.
}

...
go noCloseRange([]any{1, 2, 3}, 3) // Leaks all 3 workers
A goroutine leak profile for such a program would include the following:
Type: goroutineleak
(pprof) list noCloseRange.func1
Total: 4
ROUTINE ======================== main.noCloseRange.func1 in .../main.go
         0          3 (flat, cum) 75.00% of Total
         .          .     82:           go func() {
         .          3     84:                   for item := range ch {
         .          .     86:                           _ = item
         .          .     87:                   }
         .          .     88:           }()
We see the 3 workers blocked at the range ch operation, which
gives an ample hint as to the cause of the leak. The leak can be
addressed by simply closing the channel once all messages have been sent:
    for _, item := range list {
        ch <- item
    }
    // All items have been sent. It is now safe to close.
    close(ch)
Bonus! Eagle-eyed readers may have spotted another potential leak in this example, if the number of workers is mistakenly set to zero, which will lead the parent sender to leak:
go noCloseRange([]any{1, 2, 3}, 0) // Sender leaks with 0 workers
This is also captured by the profile:
(pprof) list noCloseRange$
Total: 4
ROUTINE ======================== main.noCloseRange in .../main.go
         0          1 (flat, cum) 25.00% of Total
         .          .     76:func noCloseRange(list []any, workers int) {
...
         .          .     92:   for _, item := range list {
         .          1     95:           ch <- item
         .          .     96:   }
While workers > 0 can be assumed to hold in realistic production systems,
goroutine leak profiles can nevertheless be used to implicitly monitor for off-chance
violations without conservative workers <= 0 checks.
Example: Method contract violations
The patterns seen so far have been relatively constrained in their lexical scope. However, as functionality is spread out across functions, methods and packages, and implementations are obfuscated by interfaces, the difficulty of manually detecting leaks drastically increases.
Such a case is exemplified in this section, with the custom worker type that embeds two channel
fields, ch and done and creates a looping goroutine with its Start method that
reads from both channels with a select statement.
Said goroutine can only be terminated by receiving a message through the done channel,
which is closed by the Stop method.
The Start method can be invoked any number of times, but if it is invoked
at least once, Stop should eventually be called.
As a result, Start and Stop form an implicit contract that dictates the order
in which the methods should be invoked.
Breaking that contract can lead to undesirable behavior,
in this case, goroutine leaks:
func MethodContractViolation() {
    items := make([]any, 10)
    // Create a new worker
    w := NewWorker()

    // Start worker
    w.Start()

    // Operate on worker
    for _, item := range items {
        w.AddToQueue(item)
    }
    // Exits without calling ’Stop’.
}

type worker struct {
    ch   chan any
    done chan any
}

type Worker interface {
    Start()
    Stop()
    AddToQueue(item any)
}

func NewWorker() Worker {
    return &worker{
        ch:   make(chan any),
        done: make(chan any),
    }
}

// Start spawns a background goroutine that extracts items pushed to the queue.
func (w *worker) Start() {
    go func() {
        for {
            select {
            case <-w.ch: // Normal workflow
            case <-w.done:
                return // Shut down
            }
        }
    }()
}

func (w *worker) Stop() {
    // Allows goroutine created by Start to terminate
    close(w.done)
}

func (w *worker) AddToQueue(item any) {
    w.ch <- item
}
This issue is further exacerbated in practice, where such custom types are only
exported as interfaces, in this case, through the non-descript
Worker type.
Clients may not even be aware of the underlying implementation and,
consequently, violate the implicit contract without realizing.
Fortunately, soliciting a goroutine leak profile can reveal the defect:
(pprof) list Start
Total: 1
ROUTINE ======================== main.(*worker).Start.func1 in .../main.go
         0          1 (flat, cum)   100% of Total
         .          .    266:   go func() {
         .          .    267:           for {
         .          1    268:                   select {
         .          .    269:                   case <-w.ch:
         .          .    270:                   case <-w.done:
         .          .    271:                           return
Naturally, the fix involves following the trail to the Start call
and adding an invocation of Stop.
Example (Cockroach): Missing unlock
The following example
is taken from CockroachDB.
It involves acquiring and releasing a lock in a loop,
but forgetting to unlock it
before executing a break statement:
type Gossip struct {
    mu     sync.Mutex
    closed bool
}

func (g *Gossip) bootstrap() {
    for {
        g.mu.Lock()
        if g.closed {
            // Missing g.mu.Unlock
            break
        }
        g.mu.Unlock()
    }
}

func Cockroach584() {
    g := &Gossip{
        closed: true,
    }
    // ...
    g.bootstrap()
    g.bootstrap() // Causes a leak
}
In such a case, the goroutine will leak when failing to acquire the lock.
(pprof) list Gossip
Total: 1
ROUTINE ======================== main.(*Gossip).bootstrap in .../main.go
         0          1 (flat, cum)   100% of Total
         .          .    165:func (g *Gossip) bootstrap() {
         .          .    166:   for {
         .          1    167:           g.mu.Lock()
         .          .    168:           if g.closed {
         .          .    170:                   break
         .          .    171:           }
         .          .    172:           g.mu.Unlock()
Adding a call to Unlock before the break addresses the issue.
Example (etcd): Unexpected channel operation orderings
This example, found in etcd, shows how an unexpected ordering between channel operations can lead to a goroutine leak:
type node struct {
    status chan chan struct{}
    stop   chan struct{}
    done   chan struct{}
}

func (n *node) Status() struct{} {
    c := make(chan struct{})
    n.status <- c
    return <-c
}

func (n *node) run() {
    for {
        select {
        case c := <-n.status:
            c <- struct{}{}
        case <-n.stop:
            close(n.done)
            return
        }
    }
}

func (n *node) Stop() {
    select {
    case n.stop <- struct{}{}:
    case <-n.done:
        return
    }
    <-n.done
}

func Etcd6857() {
    n := &node{
        status: make(chan chan struct{}),
        stop:   make(chan struct{}),
        done:   make(chan struct{}),
    }
    go n.run()
    go n.Status()
    go n.Stop()
}
The run method fires a loop which expects to
repeatedly receive messages over the status channel
(sent by invoking the Status method).
At the same time, it can also receive one message over the
stop channel (sent via the Stop method),
at which point it closes the done channel and exits.
The Stop method itself then waits to receive message
over done, which is unblocked once done is closed.
A leak may occur if the run, Status, and Stop methods
run concurrently.
The Stop and run goroutines can synchronize
and exit without receiving the message issued
by Status, causing it to block forever.
(pprof) list Status
Total: 8
ROUTINE ======================== main.(*node).Status in .../main.go
         0          8 (flat, cum)   100% of Total
         .          .     16:func (n *node) Status() struct{} {
         .          .     17:   c := make(chan struct{})
         .          8     18:   n.status <- c
         .          .     19:   return <-c
         .          .     20:}
Wrapping the send to status in a select statement
where the other case branch tries to receive a message
over done allows the goroutine running to Status
to gracefully exit if it lost the race with a Stop
call.
Example (Kubernetes): Mutual blocking between channels and mutexes
This example occurs in Kubernetes, as a result of mixing channels and locks:
type Connection struct {
    closeChan chan bool
}

type idleAwareFramer struct {
    resetChan chan bool
    writeLock sync.Mutex
    conn      *Connection
}

func (i *idleAwareFramer) monitor() {
    var resetChan = i.resetChan
    for range i.conn.closeChan {
        i.writeLock.Lock()
        close(resetChan)
        i.resetChan = nil
        i.writeLock.Unlock()
        break
    }
}

func (i *idleAwareFramer) WriteFrame() {
    i.writeLock.Lock()
    defer i.writeLock.Unlock()
    if i.resetChan == nil {
        return
    }
    i.resetChan <- true
}

func NewIdleAwareFramer() *idleAwareFramer {
    return &idleAwareFramer{
        resetChan: make(chan bool),
        conn: &Connection{
            closeChan: make(chan bool),
        },
    }
}

func Kubernetes6632() {
    i := NewIdleAwareFramer()

    go func() {
        i.conn.closeChan <- true
    }()
    go i.monitor()
    go i.WriteFrame()
}
The goroutine running WriteFrame may acquire the
idle-aware framer lock, followed by sending a message over the
resetChan channel, while the monitor goroutine
waits to receive a message over the closeChan channel.
Once a message has been dispatched, the monitor goroutine
will attempt to acquire the same lock.
However, since there isn’t any traffic over resetChan, the send operation
blocks forever, preventing the monitor goroutine from releasing
the lock.
This, in turn, causes both goroutines to leak.
(pprof) list AwareFramer
Total: 200
ROUTINE ======================== main.(*idleAwareFramer).WriteFrame in .../main.go
         0        100 (flat, cum) 50.00% of Total
         .          .     32:func (i *idleAwareFramer) WriteFrame() {
         .          .     33:   i.writeLock.Lock()
         .          .     34:   defer i.writeLock.Unlock()
         .          .     35:   if i.resetChan == nil {
         .          .     36:           return
         .          .     37:   }
         .        100     38:   i.resetChan <- true
         .          .     39:}
ROUTINE ======================== main.(*idleAwareFramer).monitor in .../main.go
         0        100 (flat, cum) 50.00% of Total
         .          .     21:func (i *idleAwareFramer) monitor() {
         .          .     22:   var resetChan = i.resetChan
         .          .     23:   for range i.conn.closeChan {
         .        100     24:           i.writeLock.Lock()
         .          .     25:           close(resetChan)
The fix is to set up a separate goroutine after a message is received
over closeChan in the monitor goroutine that drains the resetChan
before attempting to acquire the lock.
Example (Moby): Misusing sync.WaitGroup
The following example in Moby showcases how wait groups may cause leaks:
type Manager struct {
    plugins []int
}

func (pm *Manager) init() {
    var group sync.WaitGroup
    group.Add(len(pm.plugins))
    for _, p := range pm.plugins {
        go func(p int) {
            defer group.Done()
        }(p)
        group.Wait() // Block here
    }
}

func Moby25384() {
    pm := &Manager{
        plugins: []int{1, 2},
    }
    go pm.init()
}
The group wait group increments its counter
depending on the number of plugins held by the
plugin manager pm, then iterates over each plugin
and spawns a goroutine.
Each goroutine decrements the counter once it finishes
its task with the Done method.
However, group erroneously invokes Wait inside
the loop body, instead of after it!
This will cause any goroutine running the init method
when the manager has more than one plugin to leak.
(pprof) list init
Total: 1
ROUTINE ======================== main.(*Manager).init in .../main.go
         0          1 (flat, cum)   100% of Total
         .          .     17:   group.Add(len(pm.plugins))
         .          .     18:   for _, p := range pm.plugins {
         .          .     19:           go func(p int) {
         .          .     20:                   defer group.Done()
         .          .     21:           }(p)
         .          1     22:           group.Wait() // Block here
         .          .     23:   }
This can be easily addressed by moving the Wait outside
the loop.
Example (Moby): Mutual blocking between channels and mutexes
Another example in Moby showcases a mixed channel-lock leak:
type (
    State struct {
        Health *Health
    }
    Container struct {
        sync.Mutex
        State *State
    }

    Store struct {
        ctr *Container
    }

    Daemon struct {
        containers Store
    }

    Health struct {
        stop chan struct{}
    }
)

func (d *Daemon) StateChanged() {
    c := d.containers.ctr
    c.Lock()
    d.updateHealthMonitorElseBranch(c)
    defer c.Unlock()
}

func (d *Daemon) updateHealthMonitorElseBranch(c *Container) {
    c.State.Health.CloseMonitorChannel()
}

func (s *Health) CloseMonitorChannel() {
    if s.stop != nil {
        s.stop <- struct{}{}
    }
}

func monitor(c *Container, stop chan struct{}) {
    for {
        select {
        case <-stop:
            return
        default:
            handleProbeResult(c)
        }
    }
}

func handleProbeResult(c *Container) {
    c.Lock()
    defer c.Unlock()
    // Additional work...
}

func NewDaemonAndContainer() (*Daemon, *Container) {
    c := &Container{
        State: &State{&Health{
            stop: make(chan struct{}),
        }},
    }
    d := &Daemon{Store{c}}
    return d, c
}

func Moby28462() {
    d, c := NewDaemonAndContainer()
    go monitor(c, c.State.Health.stop)
    go d.StateChanged()
}
The goroutine invoking StateChanged may acquire the lock
of the container stored by the daemon, then invoke
the updateHealthMonitorElseBranch method on
the daemon, which attempts to send a message over
the stop channel of the container.
However, the goroutine running monitor
may fail to receive a message over stop, if the message
is not already in-flight, and instead unblock by picking
the default case of the select statement.
This will lead it to try to acquire the same container
lock that is already held by the StateChanged
goroutine, leading both goroutines to leak.
(pprof) list .CloseMonitorChannel
Total: 2
ROUTINE ======================== main.(*Health).CloseMonitorChannel in .../main.go
         0          1 (flat, cum) 50.00% of Total
         .          .     66:func (s *Health) CloseMonitorChannel() {
         .          .     67:   if s.stop != nil {
         .          1     68:           s.stop <- struct{}{}
         .          .     69:   }
         .          .     70:}
(pprof) list main.handleProbeResult
Total: 2
ROUTINE ======================== main.handleProbeResult in .../main.go
         0          1 (flat, cum) 50.00% of Total
         .          .     83:func handleProbeResult(c *Container) {
         .          1     84:   c.Lock()
         .          .     85:   // Additional work...
         .          .     86:   defer c.Unlock()
         .          .     87:}
The fix is to close the stop channel instead
of sending a message over it.
Since closing a channel is not a blocking operation,
the StateChanged goroutine is then able to release
the lock.
In turn, this unblocks the monitor goroutine,
which may now terminate by picking unblocked
<-stop case branch in the select statement
on the next loop iteration.
Next article: Size-Specialized Memory Allocation
Previous article: Generic Methods
Blog Index